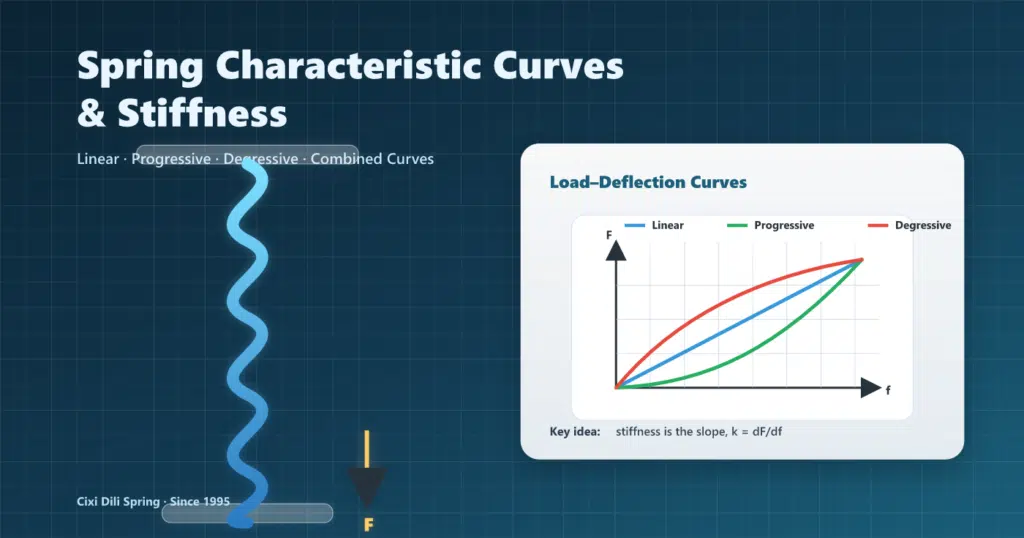
Spring stiffness is the change in force divided by the change in deflection: k = ΔF / Δf, usually in N/mm. A load–deflection curve shows whether that rate stays constant, increases, or decreases through the working stroke. For a linear spring with an initial force F0, use F = F0 + kf; F = kf applies only when the chosen zero point has no initial force.
This guide compares linear, progressive and degressive spring characteristic curves, explains rate calculations, and shows which load and travel data to include in a spring enquiry.
Quick Answer (60 seconds)
- Spring characteristic curve = the force–deflection (F–f) or torque–angle (T–φ) relationship.
- Stiffness / spring rate at a point is the curve slope: k = dF/df (or kθ = dT/dφ).
- Linear: k constant. Progressive: k increases with deflection. Degressive: k decreases with deflection.
- On non-linear curves, distinguish tangent stiffness (dF/df) vs secant stiffness (F/f) at the working point.
Table of Contents
- What Are Spring Characteristic Curves?
- Three Fundamental Curve Types
- Combined & Complex Curves
- Spring Stiffness & Spring Rate
- How Curves Guide Selection
- A Practical Selection Framework
- Practical Considerations
- Why Partner with a Manufacturer?
- Conclusion
- FAQs
What Are Spring Characteristic Curves?
A spring characteristic curve represents the relationship between the load (force F or torque T) applied to a spring and the resulting deformation (deflection f or angular displacement φ). Simply put, it’s a graphical representation of how a spring responds to increasing loads.
Think of it like this: if you push down on a spring with your hand and measure both the force you’re applying and how much the spring compresses, then plot those values on a graph, you’d create a characteristic curve. This curve tells the complete story of how that particular spring behaves under load.
Why Do Characteristic Curves Matter?
Understanding characteristic curves is crucial for several reasons:
- Predictable Performance: Engineers can accurately predict how a spring will perform in a given application
- Load Management: Knowing the curve helps in designing systems that manage loads effectively
- Safety Considerations: Critical applications require precise knowledge of spring behavior under extreme conditions
- Cost Optimization: Selecting the right spring type reduces overengineering and unnecessary costs
At Cixi Dili Spring Co., Ltd., we’ve been manufacturing springs since 1995, and we can tell you from experience that understanding these curves is often the difference between a successful application and a costly failure.
The Three Fundamental Types of Spring Characteristic Curves
Spring characteristic curves can be broadly categorized into three fundamental types, each with distinct behaviors and applications.
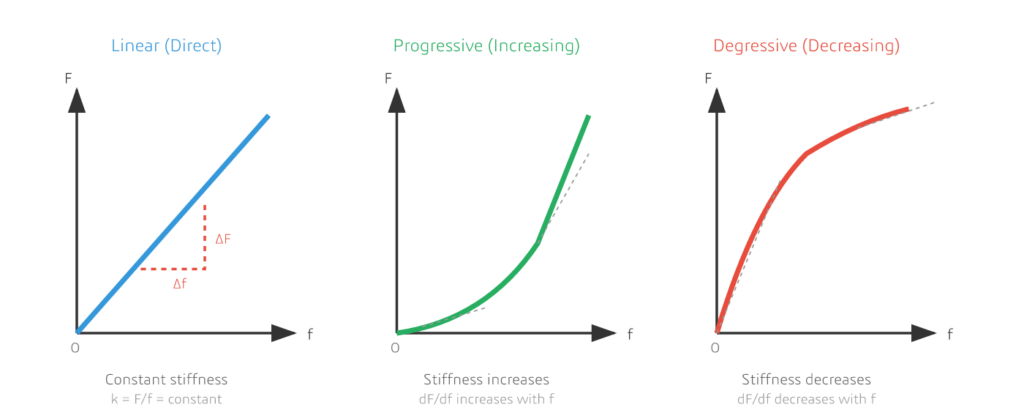
Figure 2: The three fundamental types of spring characteristic curves – Linear, Progressive (Increasing), and Degressive (Decreasing)
| Curve Type | What Happens to Stiffness (k) | Typical Designs | Best For |
|---|---|---|---|
| Linear | Constant: k = dF/df is the same across the working range | Most helical compression/extension springs, standard die springs | Predictable force at any position, easy sizing & control |
| Progressive | Increasing: k grows as deflection increases | Variable pitch, conical springs, designs that bring coils into contact | Soft initial response, overload/bottoming resistance |
| Degressive | Decreasing: k drops as deflection increases | Special geometries/material systems; some spring stacks | High initial resistance with softer follow-up response |
Linear Characteristic Curve
A linear characteristic curve is a straight line over the specified working range. Equal increments of deflection produce equal increments of force. Doubling total deflection doubles total force only when the line passes through the chosen origin.
Key Characteristics:
- The curve appears as a straight line on a load-deflection graph
- The spring rate (stiffness) remains constant throughout the working range
- Incremental form of Hooke’s law: ΔF = k × Δf, where k is the spring rate
- Most helical compression and extension springs exhibit linear behavior
Where You’ll Find Linear Springs:
- Standard compression springs in everyday applications
- Extension springs in garage doors and trampolines
- Torsion springs in clothespins and mousetraps
- JIS and US standard die springs for predictable force increases with travel
Linear springs are the workhorses of the spring industry. When you need predictable, consistent performance without any surprises, linear characteristic springs are typically your best choice.
Progressive (Increasing) Characteristic Curve
A progressive or increasing characteristic curve shows a spring that becomes stiffer as it’s compressed or extended. The curve starts relatively flat and becomes steeper as deflection increases.
Mathematical Relationship:
For progressive springs, the relationship can be expressed as:
The rate of change dF/df increases as deflection f increases
For a smooth progressive region, d²F/df² > 0: the tangent stiffness rises as deflection increases.
Practical Applications:
- Automotive suspension systems requiring soft ride with firm bottoming resistance
- Overload protection mechanisms
- Progressive rate valve springs in high-performance engines
- Conical springs in space-constrained applications
Degressive (Decreasing) Characteristic Curve
The opposite of progressive, a degressive or decreasing characteristic curve represents springs that become softer as they’re compressed. The curve starts steep and flattens out.
Where Degressive Springs Excel:
- Shock absorption where initial impact needs to be firmly resisted
- Certain types of buffer applications
- Specialized damping systems
Combined and Complex Characteristic Curves
Real-world applications often require spring behaviors that don’t fit neatly into the three basic categories. This is where combined characteristic curves come into play—springs that exhibit multiple behaviors across their working range.
Conical Volute Springs
Conical volute springs demonstrate one of the most interesting combined characteristics. These springs exhibit:
- Initial Linear Phase: At the beginning of loading, the spring behaves linearly
- Transition Point: After reaching a certain deflection, the characteristic changes
- Progressive Phase: The spring becomes increasingly stiff as coils begin to bottom out
This behavior makes conical springs ideal for applications requiring compact solid height (coils nest inside each other), controlled progressive resistance, and space-efficient high-load capacity.
Belleville (Disc) Springs
A disc spring’s load–deflection curve depends on its cone height, thickness, diameter ratio, and working range. It may be nearly linear, degressive, or include a low-rate region; an S-shaped curve is not a universal property of disc springs.
Use the manufacturer’s load data for the selected disc and stack. Series and parallel arrangements change available travel and load, while friction can create a difference between loading and unloading. These springs are often used for preload and high loads in limited space.
Ring Springs
Ring springs exhibit a characteristic curve with significant hysteresis—the loading and unloading curves don’t follow the same path. This is because:
In many ring spring assemblies, the loading curve can appear close to linear, while the unloading curve becomes more progressive due to frictional losses between ring elements.
- During loading, friction between ring elements consumes energy
- The area between loading and unloading curves represents energy dissipation
- This makes ring springs excellent for damping and vibration absorption
Combination Springs
Combination springs consist of two or more springs working together, often springs of different heights arranged in parallel. Their characteristic shows:
- Single Spring Phase: Initially, only the taller spring bears the load—linear behavior
- Transition Point: When deflection reaches the shorter spring’s engagement point
- Combined Phase: Both springs work together, increasing the overall rate
Understanding Spring Stiffness and Spring Rate
Spring stiffness, also called spring rate or spring constant, is a fundamental parameter that quantifies a spring’s resistance to deformation. It’s defined as the ratio of load increment to deflection increment.
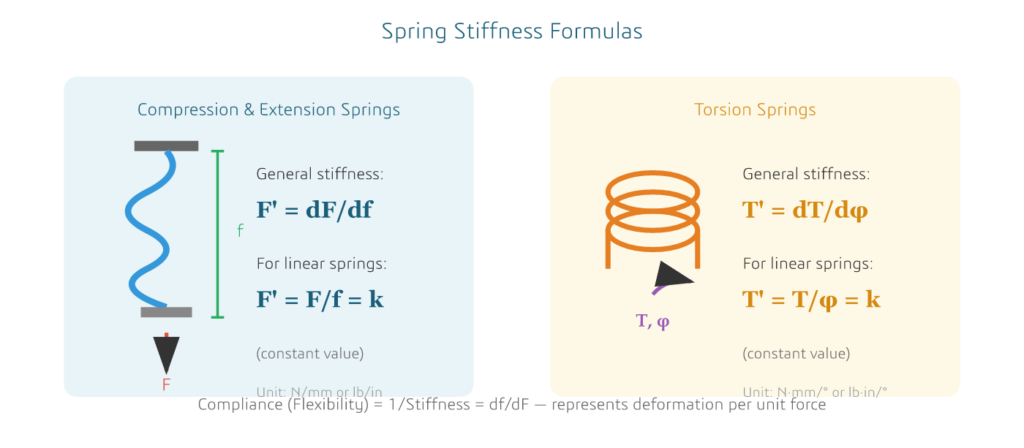
Figure 4: Basic stiffness relationships. Force/deflection and torque/angle ratios equal the linear spring rate only when the reference point has zero initial force or torque.
Stiffness Formulas Summary:
For Compression and Extension Springs:
F’ = dF/df (N/mm or lb/in)
For linear springs: k = ΔF/Δf = constant, and F = F0 + kf. The shortcut k = F/f requires F0 = 0.
For Torsion Springs:
T’ = dT/dφ (N·mm/degree)
For linear torsion springs: kθ = ΔT/Δφ, and T = T0 + kθφ. State whether angles are measured in degrees or radians; the numerical rate changes with the chosen unit.
Worked Example: Calculate Rate from Two Loads
Suppose a spring produces 100 N at 3 mm and 200 N at 8 mm, measured from the same reference position. Its average rate between those points is (200 − 100) / (8 − 3) = 20 N/mm. If the response is linear throughout this interval, the fitted relation is F = 40 + 20f, so the predicted force at 5 mm is 140 N. The 40 N offset must not be ignored.
Check additional working points before assuming linear behavior. For an extension spring, initial tension is another reason that total force divided by total extension can give the wrong rate; Lee Spring’s technical catalogue explains the initial-tension term.
Tangent vs Secant Stiffness (Non-Linear Curves)
For non-linear springs, “stiffness” depends on where you are on the curve. Two values are commonly used in design reviews and supplier communication:
- Tangent (instantaneous) stiffness: the local slope at a working point, kt = dF/df
- Secant (average) stiffness: the line from the origin to that point, ks = F/f
A tangent line at a chosen working point can be extended to its deflection-axis intercept fs. This is a geometric offset for the local approximation, not automatically the spring’s physical installed deflection or preload:
F ≈ kt × (f − fs)
Use this approximation only for small variations around that working point.
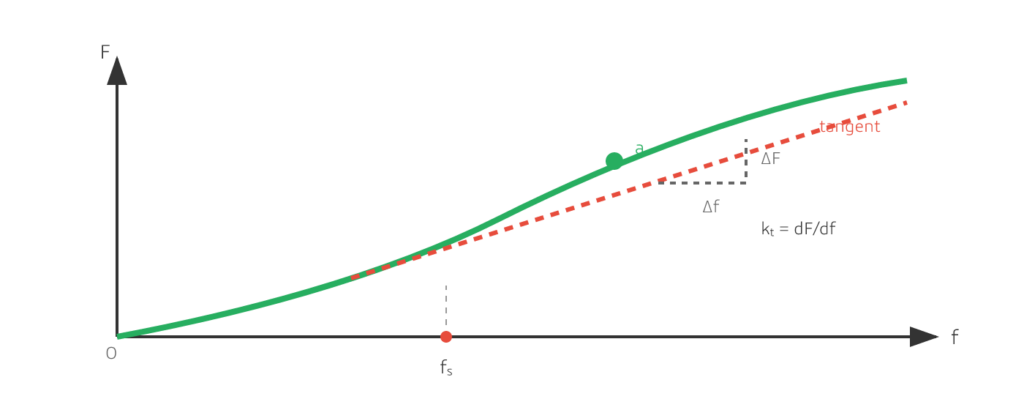
Figure 5: Tangent stiffness is the local slope; secant stiffness is measured from the chosen origin. The tangent-axis intercept fs is a mathematical offset.
Understanding Spring Compliance
The inverse of stiffness is called compliance or flexibility. It represents the deformation produced per unit of applied force. Compliance is particularly useful when analyzing systems with multiple springs, calculating deflections from known loads, and designing for specific flexibility requirements.
How Characteristic Curves Guide Spring Selection
Understanding characteristic curves isn’t just academic—it directly impacts which spring you should choose for your application. Let’s explore how different curves serve different purposes.
Linear Springs: The Reliable Workhorses
If your application requires predictable force at any position, consistent behavior throughout the working range, and easy calculation and specification, then linear characteristic springs are your best choice.
Selection tip: Specify force at two working lengths or deflections, plus allowable tolerances. For a preloaded linear spring, calculate the force change as ΔF = k × Δf and add it to the installed force.
Progressive Springs: Soft Start, Firm Finish
Applications benefiting from progressive characteristics include:
Vehicle suspension systems: A progressive design can provide a lower initial rate and a higher rate as travel increases. Its actual curve depends on geometry and coil engagement. Do not assume all progressive springs have S-shaped curves or treat coil bind as an acceptable operating stop.
Hysteresis Curves: Energy Absorption
Springs with hysteresis can dissipate part of the input energy through friction or material losses. A loading–unloading test helps quantify this effect. Some energy can still be returned, so a spring alone should not be assumed to eliminate rebound.
Selecting Springs for Your Application: A Practical Framework
Based on our decades of experience at Cixi Dili Spring, here’s a framework for selecting springs based on characteristic requirements:
| Application Type | Recommended Characteristic | Spring Types |
|---|---|---|
| Constant rate over the working range | Linear | Compression, Extension, Die Springs |
| Soft start, firm end | Progressive | Conical, Variable Pitch |
| Energy absorption | Hysteresis | Ring Springs, Disc Spring Stacks |
| High load, small space | Varies | Belleville, Wave Springs |
| Two-stage response | Combined | Combination Springs, Nested |
RFQ checklist (speeds up quoting): Share the spring type, working points (e.g., F1 @ f1, F2 @ f2), available installation space, maximum deflection, rate/curve requirement (linear/progressive/degressive), life target (cycles), environment (temperature/corrosion), tolerances, material, surface finish, and applicable standards (JIS/DIN/ASTM if any).
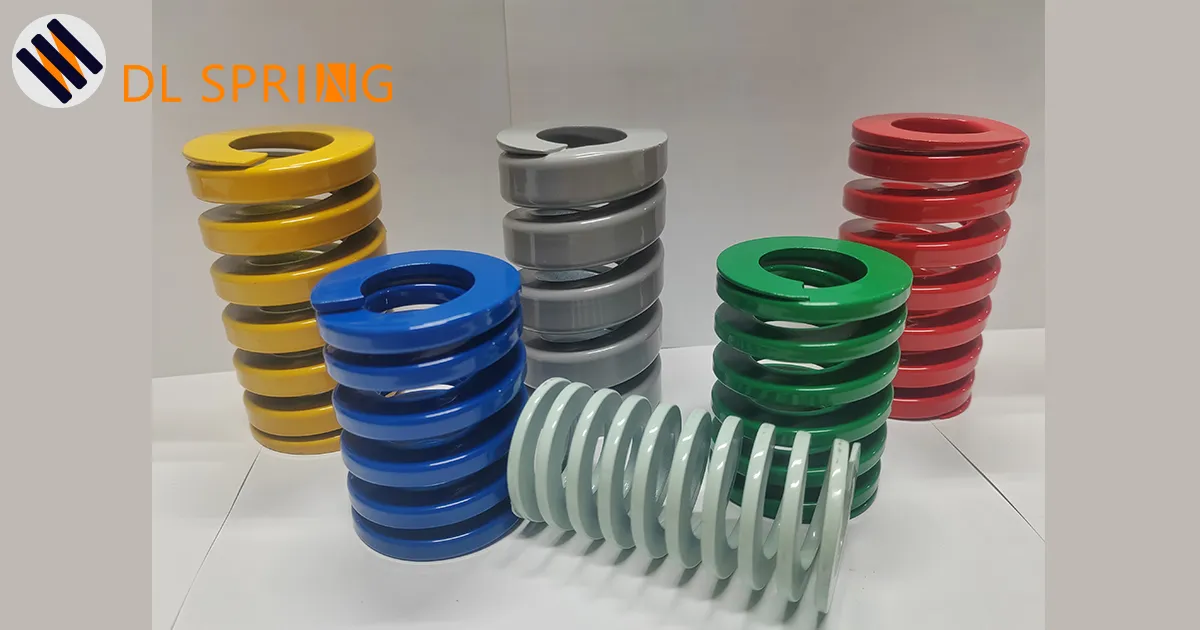
For mold applications, compare the JIS die spring color guide and ISO 10243 color code guide. Color helps identify a catalogue load class; the working load still comes from the selected part’s curve.
For a selection review, contact Dingli with your drawing or sample dimensions, two working load points, maximum travel, cycle target, and operating environment.
Practical Considerations: From Theory to Reality
While theoretical characteristic curves are calculated using mathematical models, real-world springs always show some deviation. Here’s what you need to know:
Manufacturing Tolerances
Even with the most precise manufacturing—like the processes we use at Cixi Dili Spring Co., Ltd.—variations occur due to material property variations (yield strength, modulus), dimensional tolerances (wire diameter, coil diameter, pitch), heat treatment variations, and surface finish effects.
Industry Insight: This is why critical applications always require testing actual spring samples. At Dili Spring, we can produce springs to customer samples or drawings, then verify performance through load testing to ensure characteristic curves meet specifications.
Temperature Effects
Temperature can change elastic modulus, geometry, and resistance to permanent set or stress relaxation. Select the material and operating stress using data for the actual grade, exposure time, and temperature; no single temperature limit applies to all spring designs.
Why Partner with an Experienced Spring Manufacturer?
The complexities of spring characteristic curves and stiffness calculations underscore the importance of working with knowledgeable manufacturers. Here’s what Cixi Dili Spring Co., Ltd. brings to the table:
Manufacturing support: Based in Cixi (Ningbo), Zhejiang, China, we support spring enquiries from customers worldwide. Confirm sampling, testing, documentation, and delivery requirements with your enquiry.
Three Decades of Expertise: Since 1995, we’ve been manufacturing springs for global customers, developing deep expertise in JIS standard die springs, US standard die springs, torsion springs, compression springs, music wire springs, extension springs, and custom-shaped springs for unique applications.
Design and production: Our work covers spring research and development, production, and sales. Share the required load curve, installation space, material, and applicable standards so we can review the specification.
Customization Excellence: Every application is unique. We welcome custom designs from your drawings, reverse engineering from your samples, and collaborative development for new applications.
Conclusion
Spring characteristic curves and stiffness are foundational concepts that separate successful engineering applications from problematic ones. By understanding the three basic curve types—linear, progressive, and degressive—and their combinations, you gain the ability to:
- Accurately predict spring behavior in your applications
- Select optimal springs that match your exact requirements
- Troubleshoot problems when springs don’t perform as expected
- Communicate effectively with spring suppliers about your needs
Remember, the characteristic curve tells the complete story of how a spring will behave. Whether you need the reliable consistency of a linear die spring, the sophisticated response of a progressive automotive spring, or the energy-absorbing properties of a ring spring system, understanding these curves is your key to success.
Frequently Asked Questions (FAQs)
What is the difference between spring rate and spring stiffness?
Spring rate and spring stiffness are essentially the same concept—both describe the force required to deflect a spring by a unit distance (typically expressed in N/mm or lb/in). For linear springs, this is a constant value. For non-linear springs, the “rate” varies with deflection, so we typically reference the instantaneous rate at a specific deflection point. The terms are used interchangeably in the industry.
Can a single spring have multiple characteristic curve behaviors?
Yes. In a variable-pitch compression spring, some coils may close earlier than others, reducing the number of active coils and increasing rate. Disc-stack arrangements can also change load and travel, but the available response is limited by the individual disc geometry, friction, and permitted operating range.
How do I measure the characteristic curve of an existing spring?
To measure a spring’s characteristic curve, you’ll need load testing equipment: mount the spring in a test fixture, apply incrementally increasing loads, record the deflection at each load point, plot the load-deflection data points, and connect the points to reveal the characteristic curve. For precision work, automated spring testing machines can generate these curves quickly and accurately.
Why do some springs show different curves during loading versus unloading?
This phenomenon is called hysteresis and occurs due to energy losses during the spring’s operation. The causes include friction between coils or spring elements (especially in ring springs and disc spring stacks), internal material damping (more significant in rubber or polymer springs), and mechanical interference in certain spring designs. The area between loading and unloading curves represents energy dissipated as heat.
How does temperature affect spring characteristic curves?
Temperature can change elastic modulus and spring rate, while sustained heat and stress may cause relaxation or permanent set. The amount depends on material grade, temperature, load, and exposure time. Use material data and tests at the intended conditions instead of applying a general percentage reduction.
What’s the difference between secant stiffness (F/f) and tangent stiffness (dF/df)?
On a non-linear characteristic curve, secant stiffness F/f is the average rate from the origin to a point, while tangent stiffness dF/df is the instantaneous slope at the working point. Use tangent stiffness to analyze small variations around an operating point, and secant stiffness for quick across-the-range estimates.
About Cixi Dili Spring Co., Ltd.
Cixi Dili Spring Co., Ltd. has been a trusted name in spring manufacturing since 1995. We specialize in producing high-quality springs for global customers, including die springs (JIS & US standard), torsion springs, compression springs, extension springs, music wire springs, and custom-shaped springs.
We combine spring research and development, production, and sales. Materials, load tolerances, testing, and any required standard compliance should be confirmed for the specific drawing or order.
Contact Us Today:
Email: [email protected]
WhatsApp: +86 13586942004